Futures-implied probability of a 2015 rate hike in the United States remains below 40%. Some market participants have all but dismissed this possibility as they look at weak global growth as well as soft inflation and inflation expectations in the US. Some have even suggested that the next policy move by the Fed should be a rate cut into negative territory.
 |
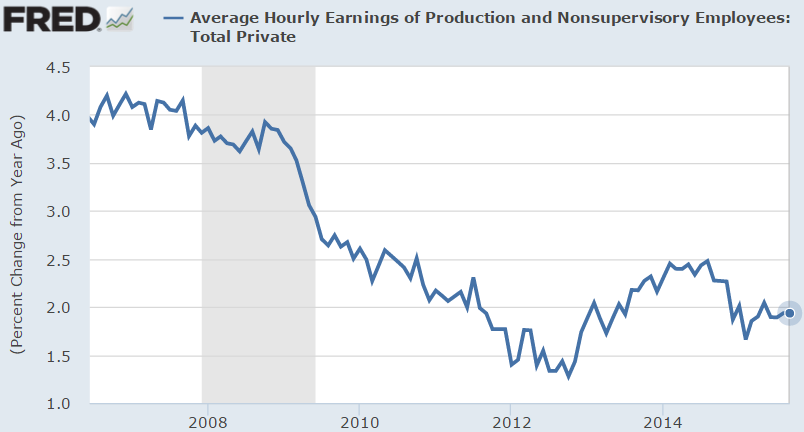
| Source: St. Louis Fed |
However global growth and US inflation expectations may not necessarily the main focus at the Fed. For example, numerous economists continue viewing the energy market crash as having only a transient impact in inflation. The logic here is that if we freeze crude oil prices at current levels (below $45/bbl), by early 2016 the year-on-year change will be around zero.

And a number of energy analysts expect crude oil prices to begin gradually rising going forward. To many forecasters this would imply that crude oil price weakness will no longer have such a severe impact on the rate of inflation.
Of course some would say that low fuel prices have not yet fully made their way through the economy - suggesting that the disinflationary pressures will persist for some time. Similarly some argue that the full effects of the dollar rally in the first half of 2015 are yet to be fully felt.
Nevertheless many economists view the headline inflation approaching the core measures by early 2016, with the core CPI turning higher as well. Moreover, a slew of recent US economic reports suggests that while the US economy probably slowed in the second half due to dollar strength and weakness abroad, the effect may be transient.
The housing market for example continues to recover and consumer sentiment and spending does not seem to be impacted by the recent market volatility.
 |
| Source: St. Louis Fed |
 |
| Source: Scotiabank |
 |
| Source: @GallupNews |
 |
| Source: Deutsche Bank, @MKTWeconomics |
Even US manufacturing which has been under pressure recently is showing signs of stabilization. The latest Markit manufacturing PMI report surprised to the upside.
 |
| Source: Markit, Investing.com |
But what about the relatively poor payrolls report for September, which clearly missed expectations? Some economists argue that this is as much about slower hiring as it is about tight labor markets. For example (as we saw in the latest Pulte Homes quarterly report), the homebuilding industry is struggling with acute labor shortages. Of course as the Wall Street Journal recently pointed out, the US housing correction has been so severe that a whole generation of construction workers has permanently exited the industry, creating shortages as the sector recovers. Nevertheless when the Fed hears about labor shortages in an industry such as housing, they take notice.
 |
| Source: WSJ |
Signs of tighter labor markets have also appeared in the latest NFIB reports on small business. When speaking with small businesses it becomes clear that there is no shortage of applications for each opening they have. But they can't seem to find people with the right experience and/or skill set (skills gap).
 |
| Source: NFIB |
Moreover, the broader unemployment measures continue to improve. Here is the so-called "U-6" for example, which according to some economists is about 1% away from "full employment" (see quote).
 |
| Source: St. Louis Fed |
Whatever the case, many argue that this is a precursor to acceleration in US wage growth. We haven't seen a great deal of evidence of that so far, but many economists (including those at the Fed) are convinced that it's only a matter of time.
One of the concerns the FOMC had in September was the risk of a rapidly deteriorating economy abroad, particularly in China. It has since become clear that while China's economy continues to slow, the combination of aggressive fiscal and monetary stimulus there is likely to cushion the decline.
 |
| Source: Investing.com |
Some may remember that in September of 2013 in the wake of the so-called "taper tantrum" the Fed decided to continue with QE. The central bank however started tapering three months later. The "playbook" this time around could be similar.
Are global markets prepared for a December liftoff? It seems that while credit markets remain cautious, there is much less uncertainty priced into US equity markets. A relatively strong employment report next week for example could reignite market volatility.
 |
| Source: BAML |
Many argue that the US economy can withstand a rate hike at this point. Indeed it can. However, given that much of the world is currently in a monetary easing mode, such a move by the Fed would result in a further rally in the US dollar. We saw the Bank of Canada strike a dovish tone recently, the PBoC is in the middle of a major easing cycle, the BoJ is in a perpetual QE, and the ECB is fully expected to expand its stimulus.
A further dollar rally would exacerbate the rout in emerging markets, potentially forcing China to resume the RMB devaluation. Disinflationary pressures in the US could worsen and the manufacturing sector would take another hit. Nevertheless, it seems that many at the Fed are willing to overlook such an outcome and begin the first rate hike cycle in nearly a decade.
_________________________________________________________________________
Sign up for our daily newsletter called the Daily Shot. It's a quick graphical summary of topics covered here and on Twitter (see overview). Emails are NEVER sold or otherwise shared with anyone.
_________________________________________________________________________
From our sponsor, Fitch Solutions: Sign-up for Inside Credit - a weekly wrap-up of noteworthy Fitch content delivered every Friday.
SoberLook.com